Managing Induced Seismicity
It’s Not Your [Geologic] Fault! You Need Seismic Self-Defense.
How to assess and manage seismic risk in oilfield operations
Earthquakes greater than 2.0 magnitude increased over 8x in the Permian Basin from 2019 to 2021. Earthquakes greater than 3.0 increased over 20x in that same period.
In December 2021 we saw a record-breaking 4.5M quake north of Stanton.
There are many possible causes of earthquakes, or seismicity. Many, of course, are naturally occurring from tectonic forces. Some quakes can be human-induced, and this is called “induced seismicity.” Seismicity may be induced by depletion of subsurface fluids, by hydraulic fracturing activity, by the collapse of subsurface mines or caverns or by the high-pressure injection of fluids into subsurface formations that intersect with geologic fault lines that have a high fault slip potential (FSP). For any given seismic event, it can be difficult or impossible to attribute a specific causal source.
Nonetheless, in many cases, saltwater disposals (SWDs), which inject oilfield wastewater at high pressures back into the subsurface where it came from, have been implicated in nearby seismic events, particularly in the recent rise of seismicity in the Permian Basin.
Starting in September 2021, in response to increases in 3.0 magnitude and larger seismic events in the Midland-Odessa area and in the Northern Delaware Basin near the Texas-New Mexico border, the Texas Railroad Commission has ordered additional reporting, permitted volume reductions and even total shut-ins of many SWDs near high seismic activity areas, now called “Seismic Response Areas” (SRAs). The specific RRC actions are described on their website, linked here.
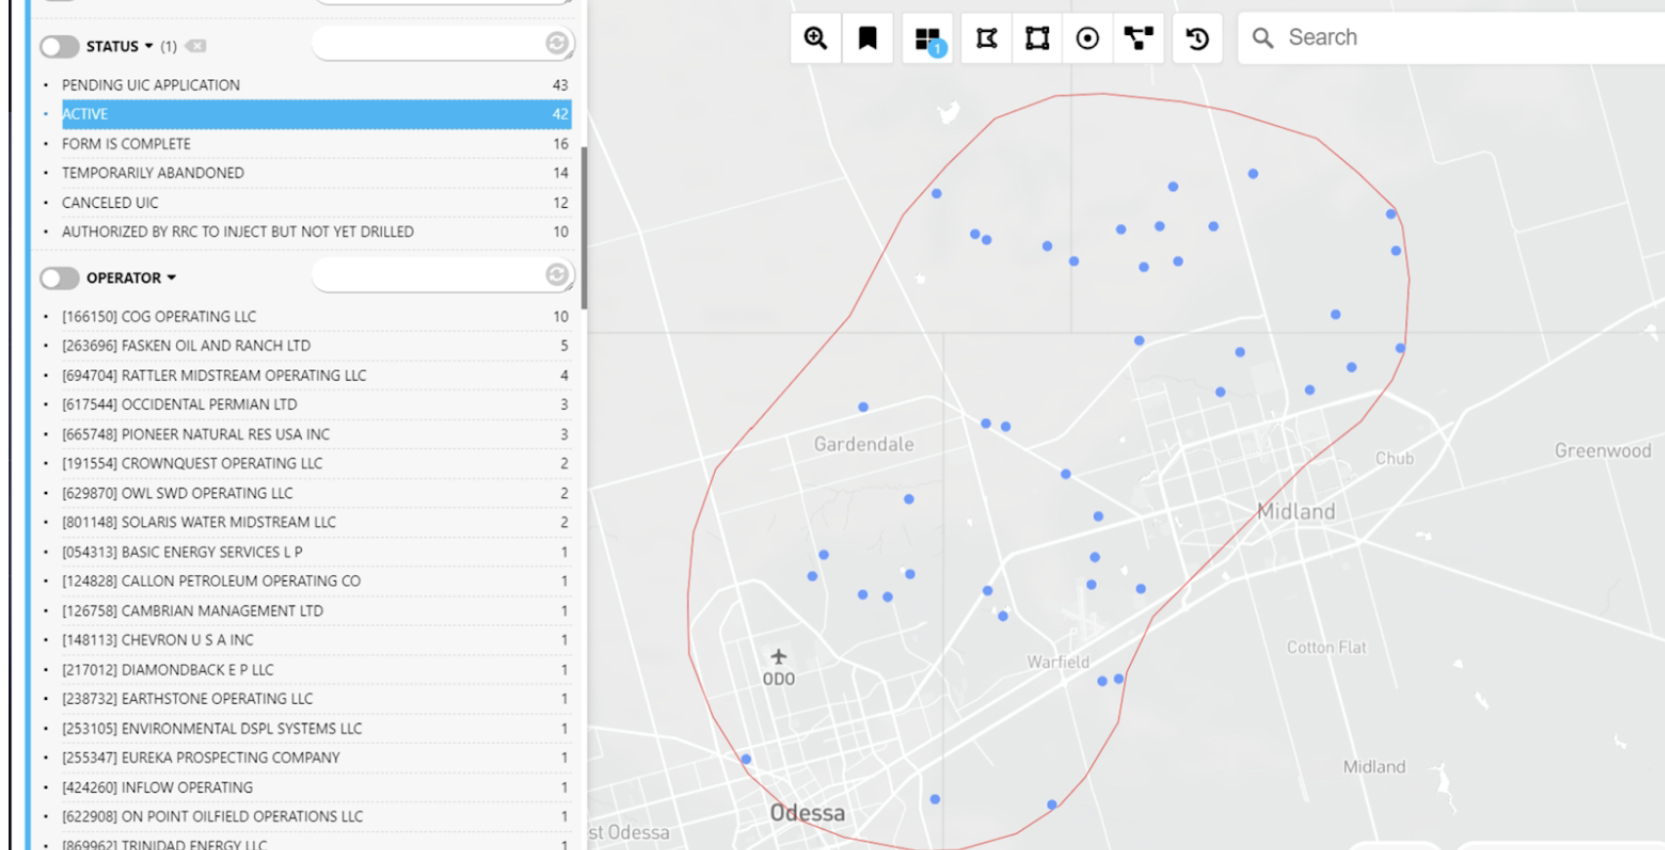
In the first case, in September 2021 after a cluster of 3.5M earthquakes around Midland, the RRC took an area called the Gardendale District around Midland and Odessa and reduced permitted daily injection capacity to 10,000 barrels per day for all 76 SWDs in the area (of which only 43 were active), regardless of the original approved permit amount, which in many cases was much higher than 10,000 BBL/day. They also put a moratorium on all new disposal permits in this area for at least one year.
In October 2021, a second SRA was put in place for the Northern Culberson-Reeves area after a series of larger earthquakes there. The NCR SRA reduced the permitted capacity of 89 SWDs.
In December 2021, after more earthquakes around Midland, the RRC ordered seven deep injection SWDs in Gardendale to shut-in. On December 17, it ordered all 33 deep injection SWDs in Gardendale to shut-in.
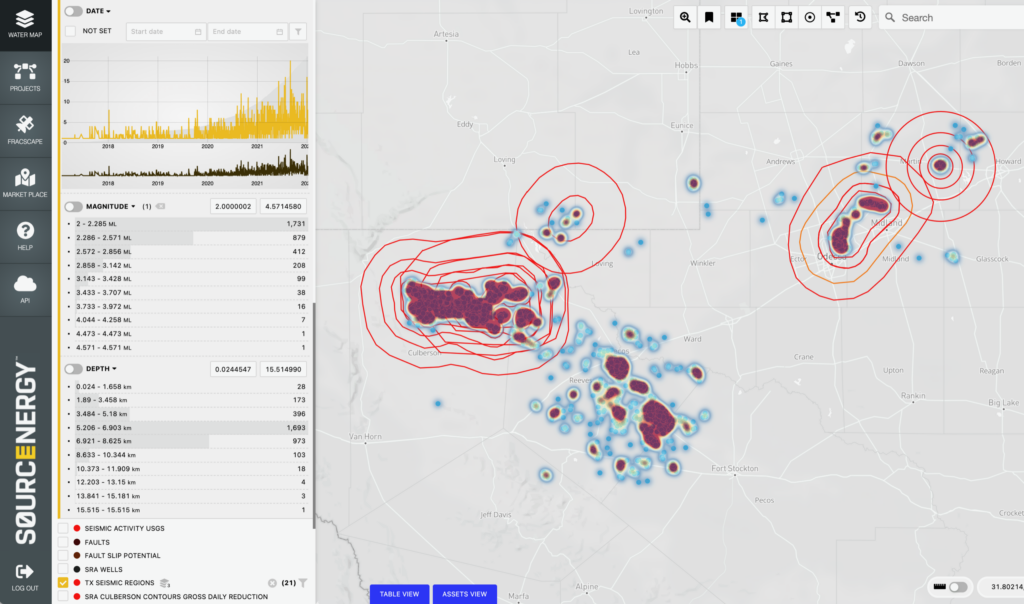
You can see on this heat map exactly where those seismic event hotspots are located (the red masses). The red circles represent where Sourcenergy has mapped out SRA boundaries and their different levels of impact.
The TX RRC also has something called a “Seismic Investigation Region” (SIR) which are areas of higher trending seismic activity under investigation for possible new SRAs.
WHO DOES THIS IMPACT
SWD capacity reductions and shut-ins don’t just affect SWD operators – some of whom are commercial water midstream companies – it also affects the oil and gas producers, the E&P companies, who produce oil that comes up with flowback and naturally-occurring produced water that needs to be recycled or disposed of. Many producers own SWDs and many send their water to a mix of their own SWDs, their own waterflood or enhanced oil recovery (EOR) injection wells, and third-party commercial SWDs.
The Permian Basin is a relative high water-to-oil ratio play, particularly in the Delaware Basin, where an 8:1 water-to-oil ratio is common. In the Midland Basin a 4:1 ratio is common, though the actual ratios vary widely with the vintage of the well, the formation of production, the timing and amount of water injected during fracturing, and many other factors.
Up until about 2014, most produced water was sent to SWDs via trucks. Water management was often the largest or even the majority lease operating expense for newer onshore unconventional wells. But since that time most operators have built water pipeline networks or entered into contracts with water midstream companies that have built water pipelines to take water from producing leases to SWDs. Moving water to SWDs by pipe costs far less per barrel than moving water by trucks – excluding the capital cost of building the pipelines. But if a water pipeline only connects to SWDs that are reduced in capacity or shut down by the SRA, the produced water might have to be put back into trucks, increasing production costs by a huge multiple for the operator or causing huge losses for a water midstream company still obliged to take the water even by truck or a longer distance pipeline.
SRAs also affect mineral owners because if operators choose to reduce oil production or new completions in high disposal cost SRAs, then there are no royalties to pay for the lost barrels.
SRAs also affect water treatment and recycling companies because reduced disposal capacity creates more incentive and more opportunities to recycle water back into new fracs. The result of which is also less water going to SWDs.
Not to be ignored, SRAs also create new opportunities for SWD owners who are near SRA-impacted SWDs but have not been impacted themselves. These SWD owners could identify water supply chains disrupted by SRAs and take that business for themselves.
How do we find, measure and reduce seismic risk?
Texas Railroad Commission
American Geophysical Union
U.S. Department of Energy
Wall Street Journal
Midland Reporter-Telegram
Proprietary Geoscience Data
- Daily Seismic Events For US
- Over 3,200 Permian geologic fault lines mapped with more than 1,800 in 3D with proprietary interpretations including formations of occurrence, strike, dip, length and type (TX,NM)
- True Active intervals of injection for most disposal and injection wells (TX,NM)
- Stratigraphic maps of all 47 Permian disposal and injection and disposal wells (TX,NM)
- True formations of disposal, injection and production for most oil, gas, injection and disposal wells (TX,NM)
- Induced seismicity risk analytics for all existing SWDs (TX,NM)
- Cumulative injection and production volumes by true formation of injection and area (TX,NM)
- Produced water flowcharts show seismic risks hidden in the supply chain
- Disposal ScorecardTM automated SWD application grading and documentation (TX)
- All data is exportable for use in other applications
Additional Information
View Videos
How do we find, measure and reduce seismic risk?
- Define any area of interest (AOI) in Texas and immediately identify which disposals are impacted by new SRA rules
- See who owns the SWD
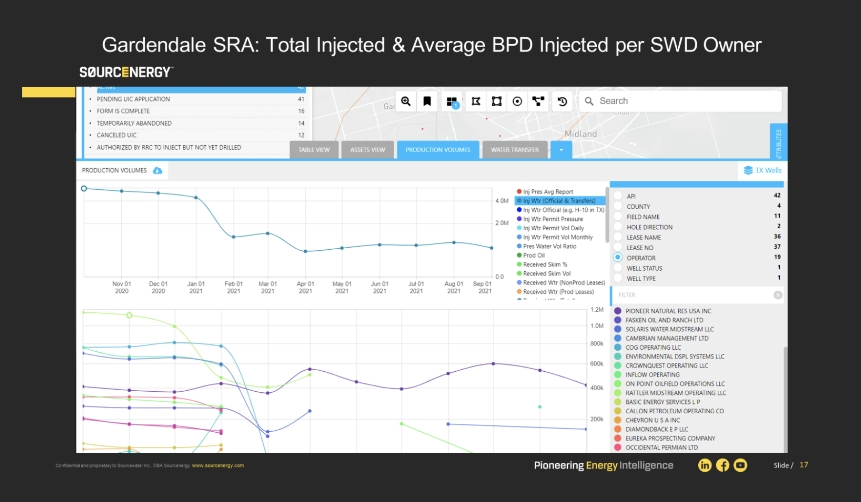
- See how much water per day has been going into each SRA-impacted SWD and by how much that volume exceeds the new reduced permit levels at the individual facility level and by operating company
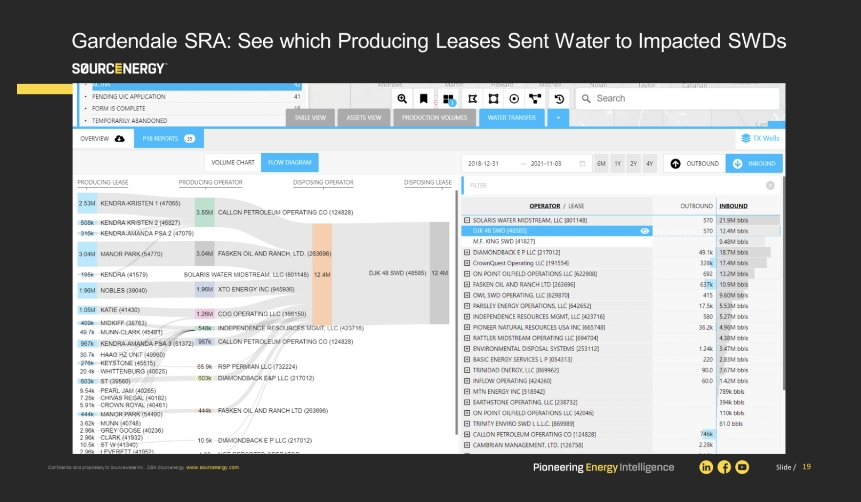
- See exactly which oil and gas producing leases have been sending water to each SRA-impacted SWD, how much oil, gas and water those leases have been producing, and the locations of those impacted producing leases
- Identify the best alternative destinations for disposal and recycling for each impacted producing lease
- Predict future and trending seismic risk for SWDs by viewing over 3,000 geologic fault lines mapped in 3-D, most with FSPs; the true active depths and formations of injection for every SWD, and every seismic event location, depth and magnitude
- Make good decisions about new water management plans without seeing them disrupted again by the next SRA expansion.
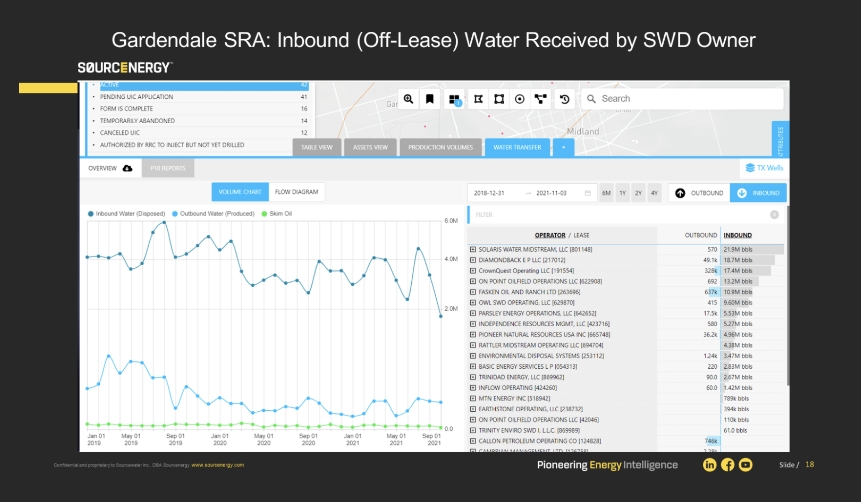
You can see, for each SRA SWD, how much water is coming from other leases, not just from that same lease. Obviously, if the water is coming from the same lease then you know it is a lease that’s in the impacted area. The question is who is being impacted by a reduction in barrels on a disposal in that location?
Sourcenergy traces the water from disposals that are affected to the operators and the exact producing lease locations that sent the water. Often the lease of origin may be outside the SRA. Our system automatically generates water flow charts that show, for every operator and every lease owned by that operator, how much water is going to each and every disposal lease.
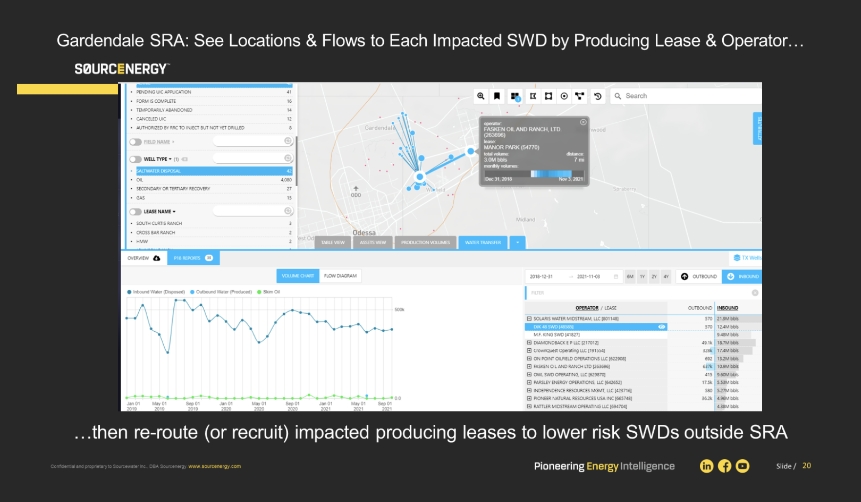
Below is an example of an active commercial disposal in the Gardendale SRA. You can see on the spider charts exactly which producing leases, from which operators, were sending water to the impacted disposal. From there you can see if they are inside or outside of that seismic response area, how much oil and gas production is at risk of disruption and the best alternative destinations for water from that lease.
Now you can take action.
On the producer side you can figure out where you could reroute that water to an SWD that has excess capacity and lower seismic risk, whether outside or inside the SRA. We’ve mapped over 3,000 geologic fault lines in 3-D, most with fault slip potentials, so you can avoid higher seismic risk SWDs that have not yet been impacted by RRC policies but might be designated soon.
You can see nearby water pipelines that might offer cost-effective opportunities to ship water further distances at low cost to lower risk SWDs even if there are no good SWD options with capacity close by – Sourcenergy has mapped over 10,000 miles of water pipelines in the Permian.
You could also look for recycling opportunities with commercial recycling facilities or operators preparing to frac – Sourcenergy tracks drilling permits, well pad construction, drilling rigs, DUCs and even frac crews in near real-time, so you can see exactly where demand for water recycling is going.
If you are a disposal company or recycling company you might want the geospatial water intelligence that shows you which operators need your services and exactly where and when and how much they need.
For example, you can contact the operator and say “I see you’re sending your water to a disposal that’s been impacted by a new SRA. You should send it to our location because we’re outside of that risk area. And we’re the closest disposal to you that can take your water without a problem, or we have an existing water pipeline with capacity that runs near your lease.”
There is no better way to respond to the fast-developing landscape of seismicity risk.
Anticipate Future Risks
You have to be nimble to respond to unexpected developments. But it’s even better to anticipate what’s going to happen and plan ahead for that.
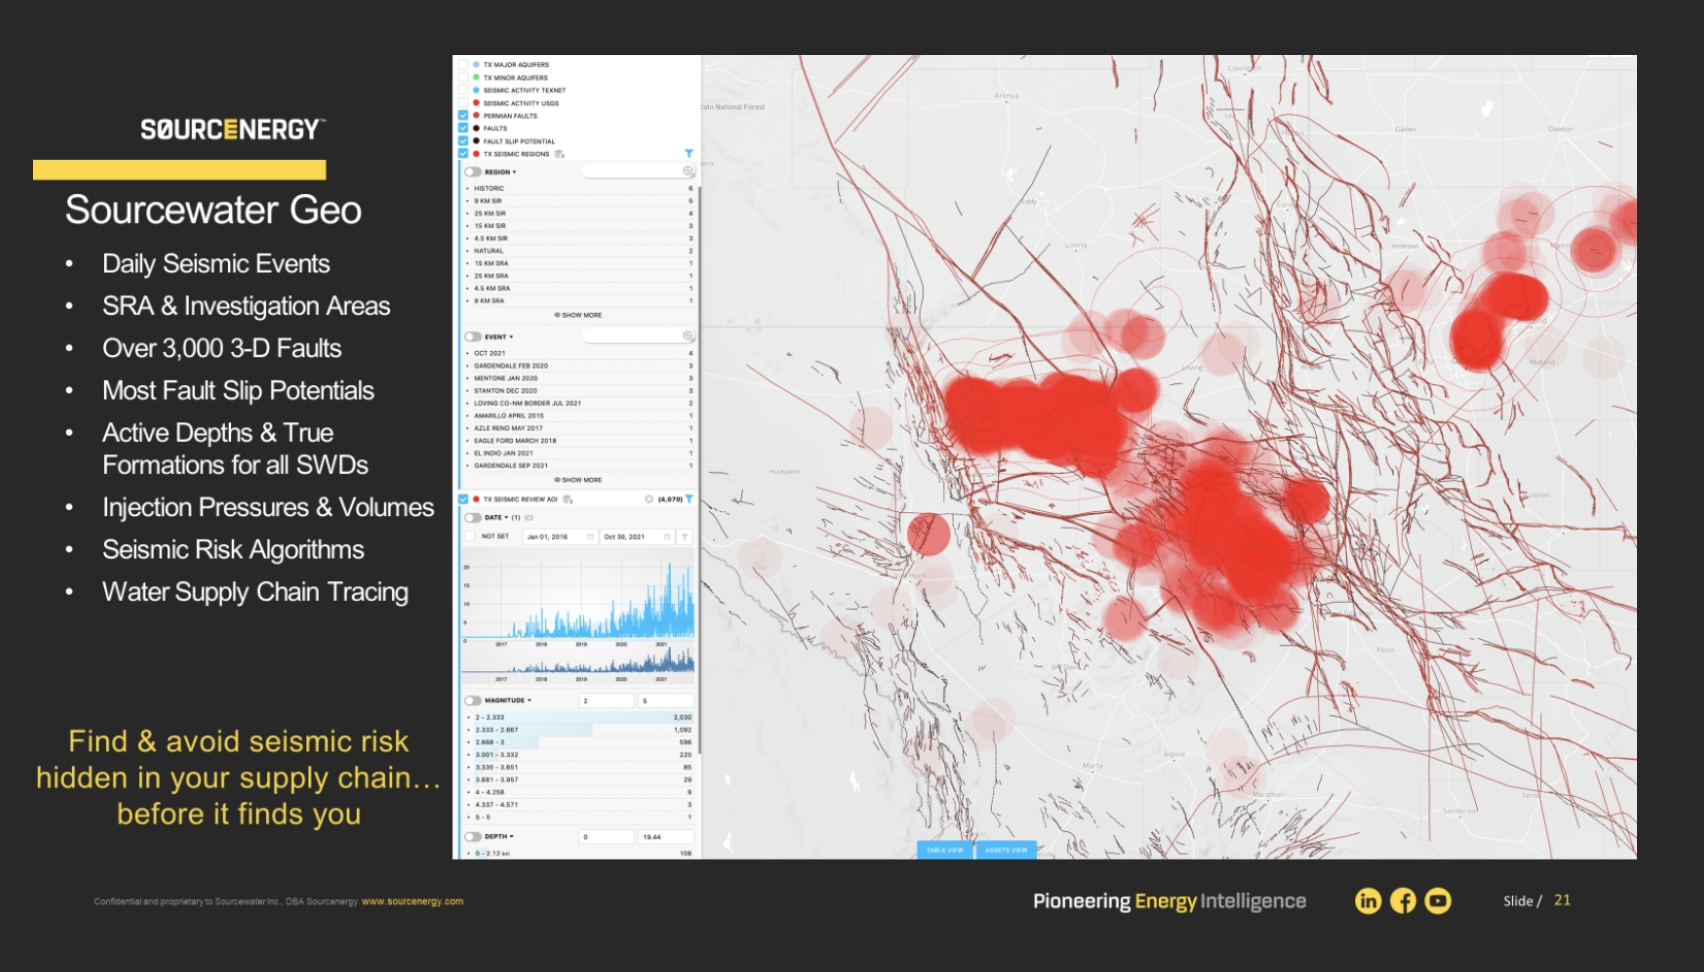
Better Risk Management with Sourcewater Geo
We’ve created a platform called Sourcewater Geo that puts together proprietary 3-D maps of over 3,000 fault lines in the Permian Basin (most of which have fault slip potentials calculated).
It shows the true formations and depths of injection for each of those disposals. From this you can see where those injection formations come close to intersecting the sensitive parts of those fault lines.
You also get the data and analytics showing all the volumes and the pressures of injection for every SWD so that you can understand where there is risk today. Then you can take action in your water supply chain before that seismic risk becomes a problematic seismic event.
